
I’ve been looking in the past couple of weeks for posts testing large insert speeds in SQL Server between different scenarios, and was unable to find anything more recent that matched my requirements.
As a result, I’ve decided to do my own tests and cover a broader set of scenarios. This isn’t exhaustive by any means, but it should help paint a more detailed picture for anyone having to deal with similar topics. It also gives some tips on how to improve large insert performance in SQL Server.
Test environment
First, a rundown of my test environment:
I’m running SQL Server 2019 CU19, with MAXDOP set to 8, CTP set to 60, and Max Memory limited to 24GB
The database resides on a Samsung 980 Pro SSD.
| 1 2 3 4 5 6 7 8 9 10 11 12 13 14 15 16 17 18 19 20 | USE master GO IF EXISTS (SELECT 1 FROM sys.databases WHERE [name] = N'InsertTest') BEGIN DROP DATABASE [InsertTest] END GO CREATE DATABASE [InsertTest] CONTAINMENT = NONE ON PRIMARY ( NAME = N'InsertTest', FILENAME = N'F:\VSQL\InsertTest.mdf' , SIZE = 10485760KB , FILEGROWTH = 1048576KB ) LOG ON ( NAME = N'InsertTest_log', FILENAME = N'F:\VSQL\InsertTest_log.ldf' , SIZE = 10485760KB , FILEGROWTH = 524288KB ) GO ALTER DATABASE [InsertTest] SET COMPATIBILITY_LEVEL = 150; GO |
Tables
Source table: In my InsertTest database, I create a 16 million records copy of the Users table from the StackOverflow database without the AboutMe column because I’m not really interested in NVARCHAR(MAX) data for this test.
| 1 2 3 4 5 6 7 8 9 10 11 12 13 14 15 16 17 18 19 20 21 22 23 24 25 26 27 28 29 | /*Creating the source table with the first batch*/ SELECT TOP (8000000) [Id],[Age],[CreationDate], [DisplayName],[DownVotes], [EmailHash],[LastAccessDate], [Location],[Reputation], [UpVotes],[Views], [WebsiteUrl],[AccountId] INTO [UsersSource] FROM [StackOverflow].[dbo].[Users]; /*Put an index on it*/ CREATE UNIQUE CLUSTERED INDEX [Users_IX] ON [UsersSource]([Id]); /*Second batch*/ INSERT INTO UsersSource ([Age],[CreationDate], [DisplayName],[DownVotes], [EmailHash],[LastAccessDate], [Location],[Reputation], [UpVotes],[Views], [WebsiteUrl],[AccountId]) SELECT TOP (8000000) [Age],[CreationDate], [DisplayName],[DownVotes], [EmailHash],[LastAccessDate], [Location],[Reputation], [UpVotes],[Views], [WebsiteUrl],[AccountId] FROM [StackOverflow].[dbo].[Users]; |
The target tables’ structure is a copy of the source table, so I can be lazy about their creation.
| 1 2 3 4 5 6 7 8 9 10 11 12 | /*Heap table*/ SELECT TOP 0 * INTO [HeapUsers] FROM [UsersSource]; /*Clustered index table*/ SELECT TOP 0 * INTO [ClusterUsers] FROM [UsersSource]; CREATE UNIQUE CLUSTERED INDEX [ClusterUsers_IX] ON [ClusterUsers]([Id]); /*CCI table*/ SELECT TOP 0 * INTO [CCIUsers] FROM [UsersSource]; CREATE CLUSTERED COLUMNSTORE INDEX [CCIU_IX] ON [CCIUsers]; |
For the test runs with full recovery model, I change the recovery model and take a dummy backup to initiate the LSN.
| 1 2 3 4 5 6 7 8 | /*Set recovery model to full*/ ALTER DATABASE [InsertTest] SET RECOVERY FULL; GO /*Take a dummy full backup to initiate the LSN NUL (yes,with just one L) allows us to discard the backup without writing it to disk*/ BACKUP DATABASE [InsertTest] TO DISK = 'NUL'; GO |
Test scenarios
The test will consist of one 16 million record insert.
The insert will target three table types:
- heap
- clustered table
- clustered columnstore table
On each table type I will be looking into the impact of:
- identity columns
- compression (none vs page vs columnstore)
- query hints (TABLOCK in combination with MAXDOP 0)
- recovery model (simple vs full)
What the tests will measure:
- Execution duration in milliseconds
- CPU time of the table insert operator
- Table sizes (between compressed and non-compressed)
- Transaction log usage (with
DBCC SQLPERF(logspace))
The tables will be truncated between tests.
In the tests using the full recovery mode, I’m issuing a checkpoint and taking a transaction log backup using the following command:
| 1 2 3 4 5 6 7 8 9 10 11 12 13 14 15 16 17 18 19 20 | USE [InsertTest] GO CHECKPOINT; GO /*For the tests with full recovery I also take tlog backups*/ USE [master] GO BACKUP LOG [InsertTest] TO DISK = 'NUL'; GO /*table truncate example*/ USE [InsertTest] GO TRUNCATE TABLE [HeapUsers]; GO CHECKPOINT; GO USE [master] GO BACKUP LOG [InsertTest] TO DISK = 'NUL'; GO |
For the tests involving page compressed tables, I just rebuild the tables with DATA_COMPRESSION = PAGE.
For every table I’m also doing two initial “baseline” inserts without setting IDENTITY_INSERT to ON and letting the Id column generate the IDs
An example of the insert statement:
| 1 2 3 4 5 6 7 8 9 10 11 12 13 14 | INSERT INTO [HeapUsers] ([Id],[Age],[CreationDate], [DisplayName],[DownVotes], [EmailHash],[LastAccessDate], [Location],[Reputation], [UpVotes],[Views], [WebsiteUrl],[AccountId]) SELECT [Id],[Age],[CreationDate], [DisplayName],[DownVotes], [EmailHash],[LastAccessDate], [Location],[Reputation], [UpVotes],[Views], [WebsiteUrl],[AccountId] FROM [UsersSource]; |
Insert duration
The following results are for inserts that have been done with IDENTITY_INSERT set to ON.
Full recovery model
First, let’s look at the insert statement’s execution duration.
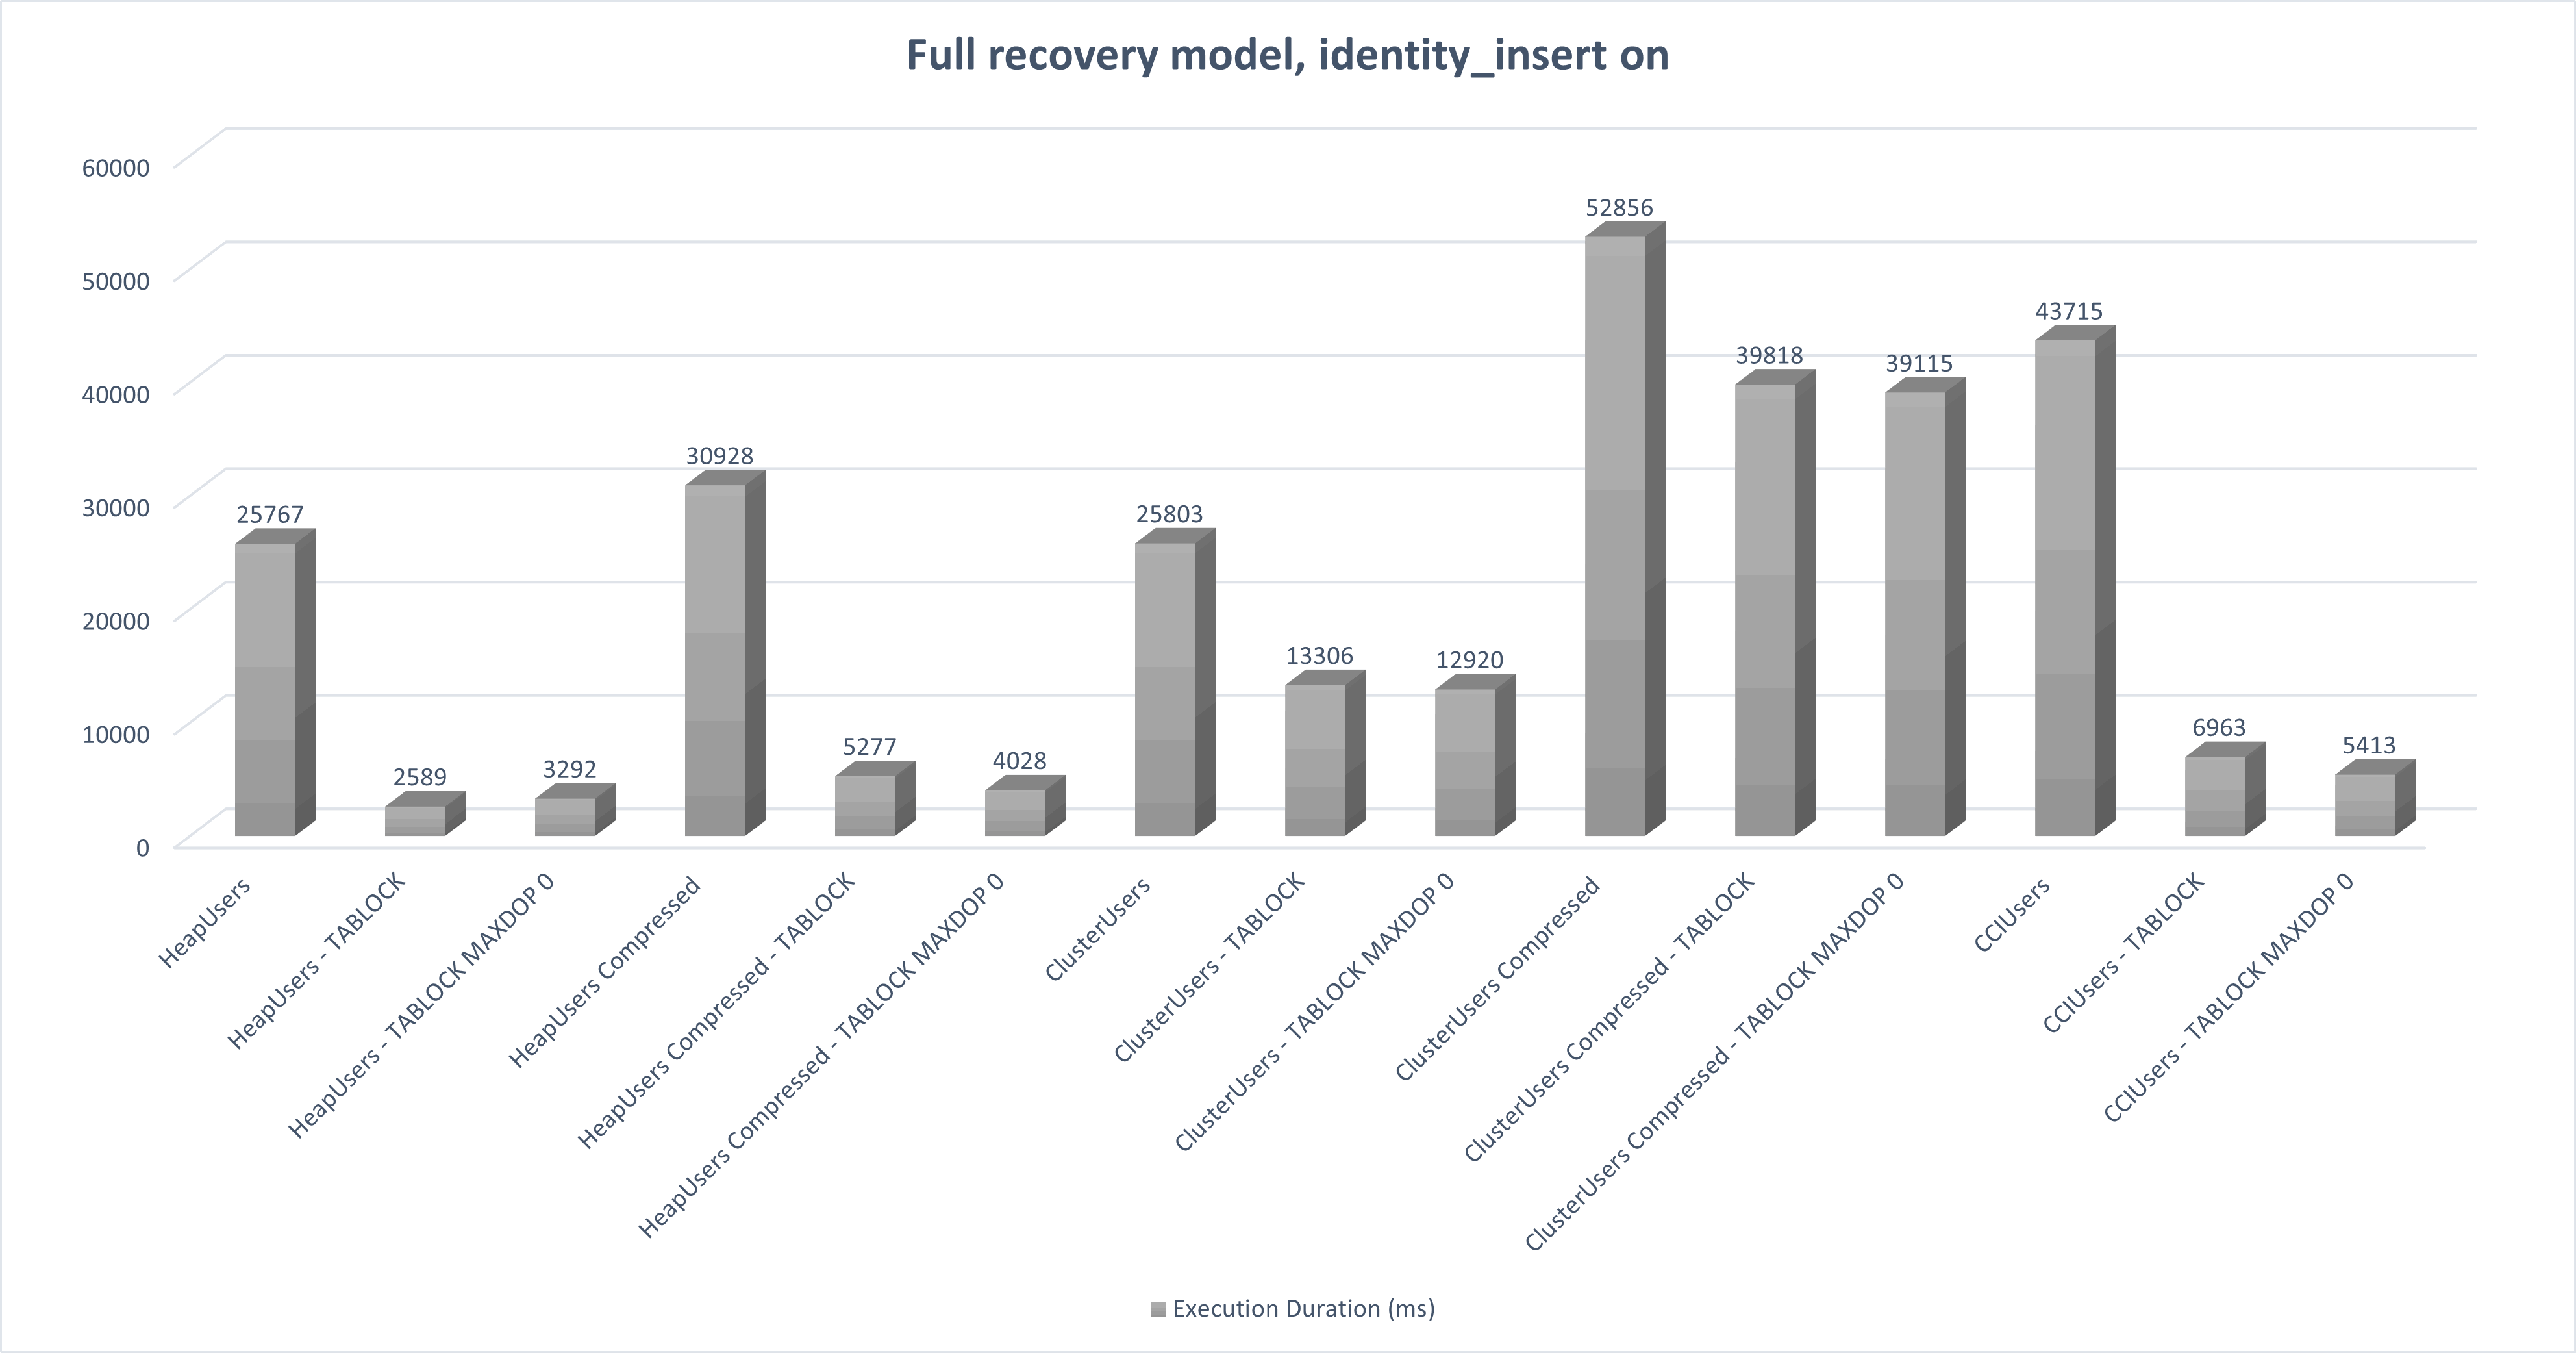
The effects of the TABLOCK query hint are noticeable in all cases, but the most impressive speed improvements are seen on heaps and clustered columnstore tables.
And MAXDOP 0 helps further improve the speed of bulk inserts in the case of the compressed heap table and the clustered columnstore table.
Now including the CPU time, in milliseconds, of the insert operator.

This chart helps outline two tings:
- the impact that compression has on both CPU time and execution time
- the increased CPU time brought on by parallel inserts in compressed tables when using the TABLOCK hint, as well as the additional CPU time incurred by using more than 8 threads when MAXDOP 0 is specified
The ClusterUsers being an interesting exception, with TABLOCK reducing the execution time, but not to a degree that would be similar with the HeapUsers and CCIUsers table.
In this case, the execution plans help give a reason for that.
First, the execution plan of the insert that doesn’t use any hint, marked as ClusterUsers on the above charts, and having a duration of 25803 milliseconds.

So far, it looks like all the operations went parallel except for the Clustered Index Insert one. This can be easily noticed by the presence of the 2 parallel arrows pointing left in the bottom-right corner of every operator that went parallel and the lack thereof on the Insert operator. TABLOCK usually makes inserts go parallel, so it should help here too, right?

Well, not really. The above plan is for the insert into ClusterUsers using the TABLOCK hint, but the insert operator is still single-threaded.
Ok, maybe MAXDOP 0 can force SQL Server to make the clustered index insert goes parallel (?)


Aside from making the other parallel operators, in this case the Clustered Index Scan and the Sort, go faster due to the workload being split across 24 threads instead of 8 (the instance’s default MAXDOP), the insert is still single threaded.
This is because the Clustered Index Insert operator does not support parallelism, it can only be used in serial execution plans or, like in this case, in a serial section of an execution plan.
Now, if you think about the nature of a clustered index, the reason why parallelism wouldn’t be supported becomes clear. You can’t really insert data in a specific order if you try to jam it into the table in multiple threads.
But what about the Clustered Columnstore Index insert?
To make it easier to see, I’ll just isolate the CCIUsers insert in their own chart.

It’s pretty obvious that TABLOCK is doing something here, even if it’s a clustered columnstore index.
Looking at the execution plan reveals exactly what’s happening.

The simple insert is unremarkable, all operations are single-threaded and the insert takes a noticeable amount of time.
But this changes when TABLOCK is used.
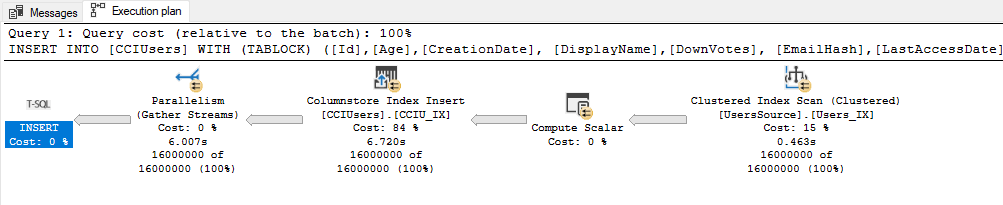
Here it’s noticeable that the Columnstore Index Insert operation does indeed go parallel.
This diagram from the Microsoft documentation page explains it best:

As the diagram suggests, a bulk load:
- Does not pre-sort the data. Data is inserted into rowgroups in the order it is received.
- If the batch size is >= 102400, the rows are directly into the compressed rowgroups. It is recommended that you choose a batch size >=102400 for efficient bulk import because you can avoid moving data rows to delta rowgroups before the rows are eventually moved to compressed rowgroups by a background thread, Tuple mover (TM).
- If the batch size < 102,400 or if the remaining rows are < 102,400, the rows are loaded into delta rowgroups.
This raises an interesting question.

Using sp_BlitzIndex, I can check the order of each row group and their contents.
| 1 | EXEC sp_BlitzIndex @TableName = 'CCIUsers', @ShowColumnstoreONly = 1; |
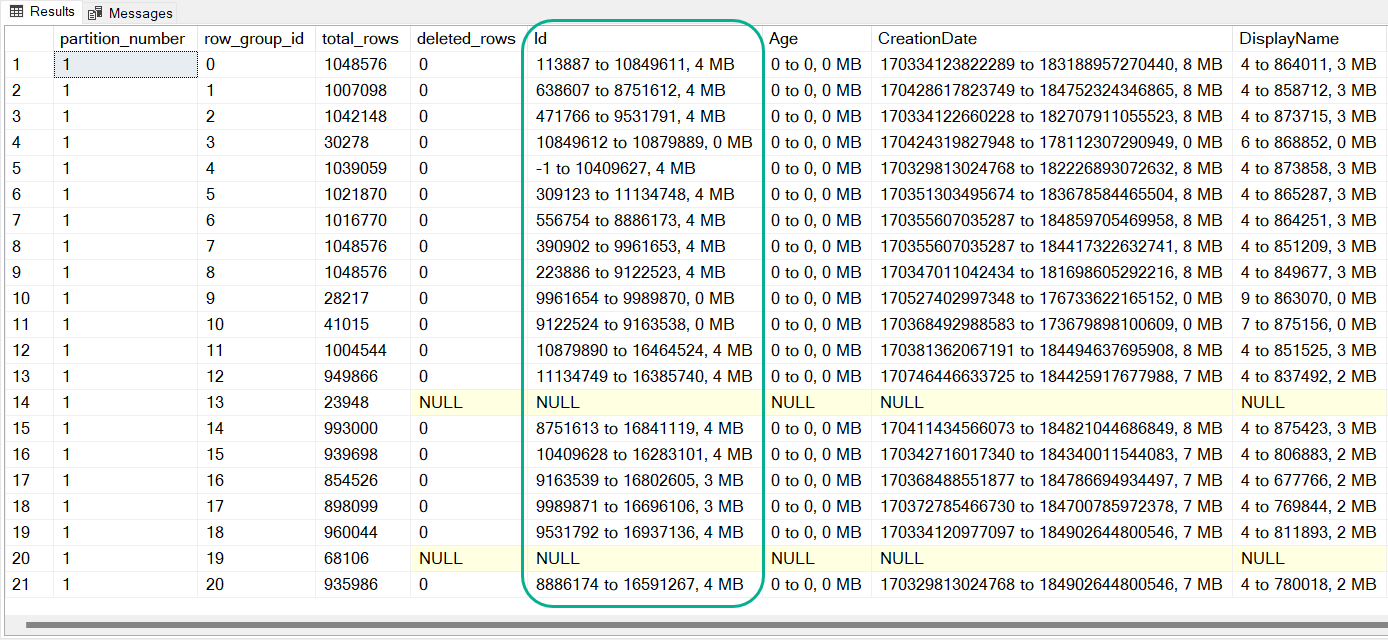
Notice how the ID ranges are all over the place and aren’t really ordered. And there are also 2 delta store row groups (ids 13 and 19) which are basically heaps mapped to the clustered columnstore table.
This is ok if you don’t care about data being sorted properly which helps reduce the number of row groups SQL Server will have to look through when querying the table.
If you want to have the data nicely sorted, then the insert has to go serial meaning that you either remove TABLOCK from the insert or throw MAXDOP 1 in the mix.
For example’s sake, this how the row groups look like for the simple insert into the CCIUsers table.

The outcome being, in this case, the Id ranges increase in step with the row_group_id and there are 0 delta store row groups.
Simple recovery model
Looking at the insert speeds when the database is in the simple recovery model, the speeds aren’t dramatically different.

With the same being true in the case of the insert operation’s CPU time.

What happens when doing the insert without setting IDENTITY_INSERT ON?
In all the above example, IDENTITY_INSERT was set to ON for the table targeted by the insert.
Here’s an example:
| 1 2 3 4 5 6 7 8 9 10 11 12 13 14 15 16 | SET IDENTITY_INSERT [HeapUsers] ON; INSERT INTO [HeapUsers] WITH (TABLOCK) ([Id],[Age],[CreationDate], [DisplayName],[DownVotes], [EmailHash],[LastAccessDate], [Location],[Reputation], [UpVotes],[Views], [WebsiteUrl],[AccountId]) SELECT [Id],[Age],[CreationDate], [DisplayName],[DownVotes], [EmailHash],[LastAccessDate], [Location],[Reputation], [UpVotes],[Views], [WebsiteUrl],[AccountId] FROM [UsersSource]; SET IDENTITY_INSERT [HeapUsers] OFF; |
But what happens if I don’t change IDENTITY_INSERT and just let the identity column generate new IDs for the records?
Quick example of an insert in HeapUsers without setting IDENTITY_INSERT ON:
| 1 2 3 4 5 6 7 8 9 10 11 12 13 14 | INSERT INTO [HeapUsers] WITH (TABLOCK) ([Age],[CreationDate], [DisplayName],[DownVotes], [EmailHash],[LastAccessDate], [Location],[Reputation], [UpVotes],[Views], [WebsiteUrl],[AccountId]) SELECT [Age],[CreationDate], [DisplayName],[DownVotes], [EmailHash],[LastAccessDate], [Location],[Reputation], [UpVotes],[Views], [WebsiteUrl],[AccountId] FROM [UsersSource]; |
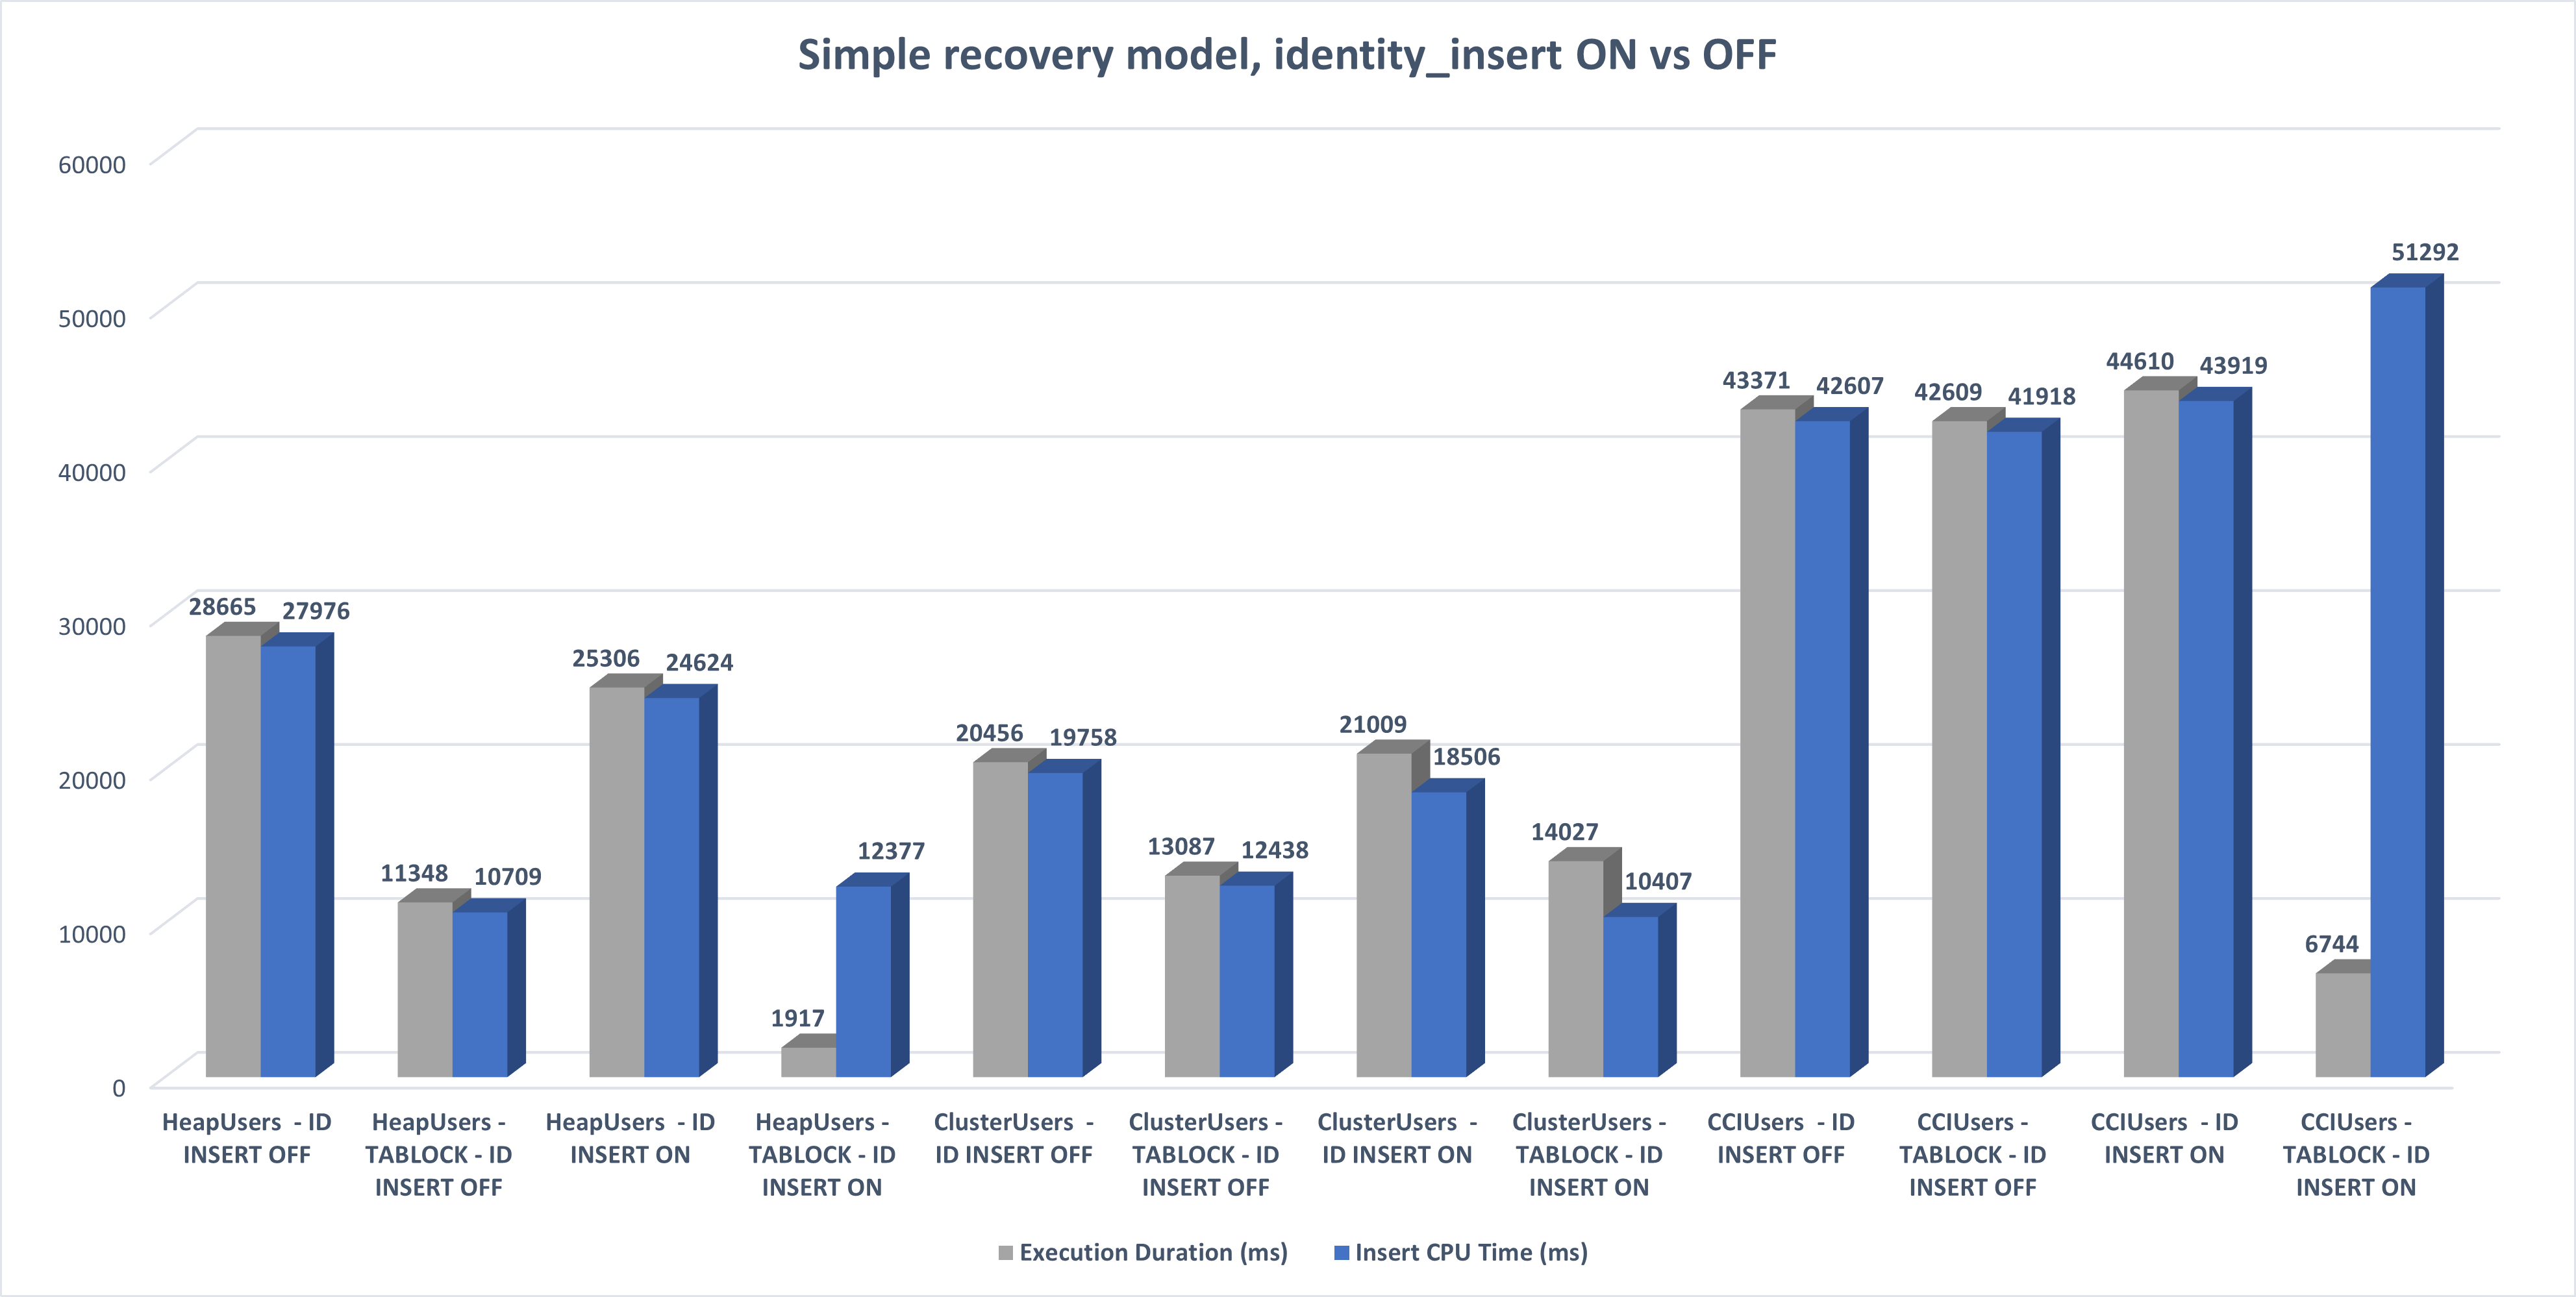
Notice how inserts marked with ID INSERT OFF take pretty long in cases where they’d usually go fast, e.g. on HeapUsers and CCIUsers with TABLOCK.
Looking at the execution plan reveals why that’s happening.

The insert operation is not going parallel, this can be confirmed also by looking at the properties of the Table Insert operator.
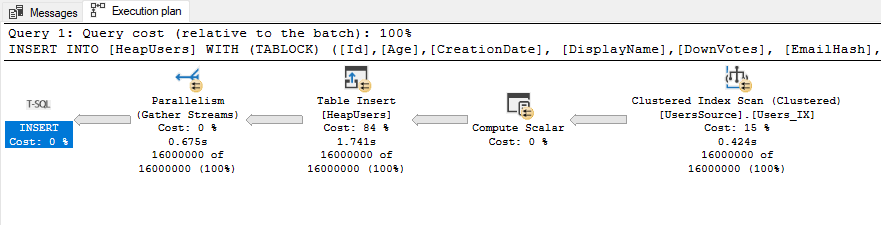
For comparison’s sake, this is how the IDENTITY_INSERT ON plan looks like.
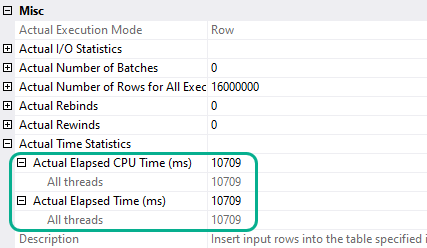
Looking at the Table Insert operator’s properties, we can see that insert is spread across 8 threads.

Transaction log usage
Note that MAXDOP 0 inserts aren’t included in the chart, because it has no bearing on transaction log usage.
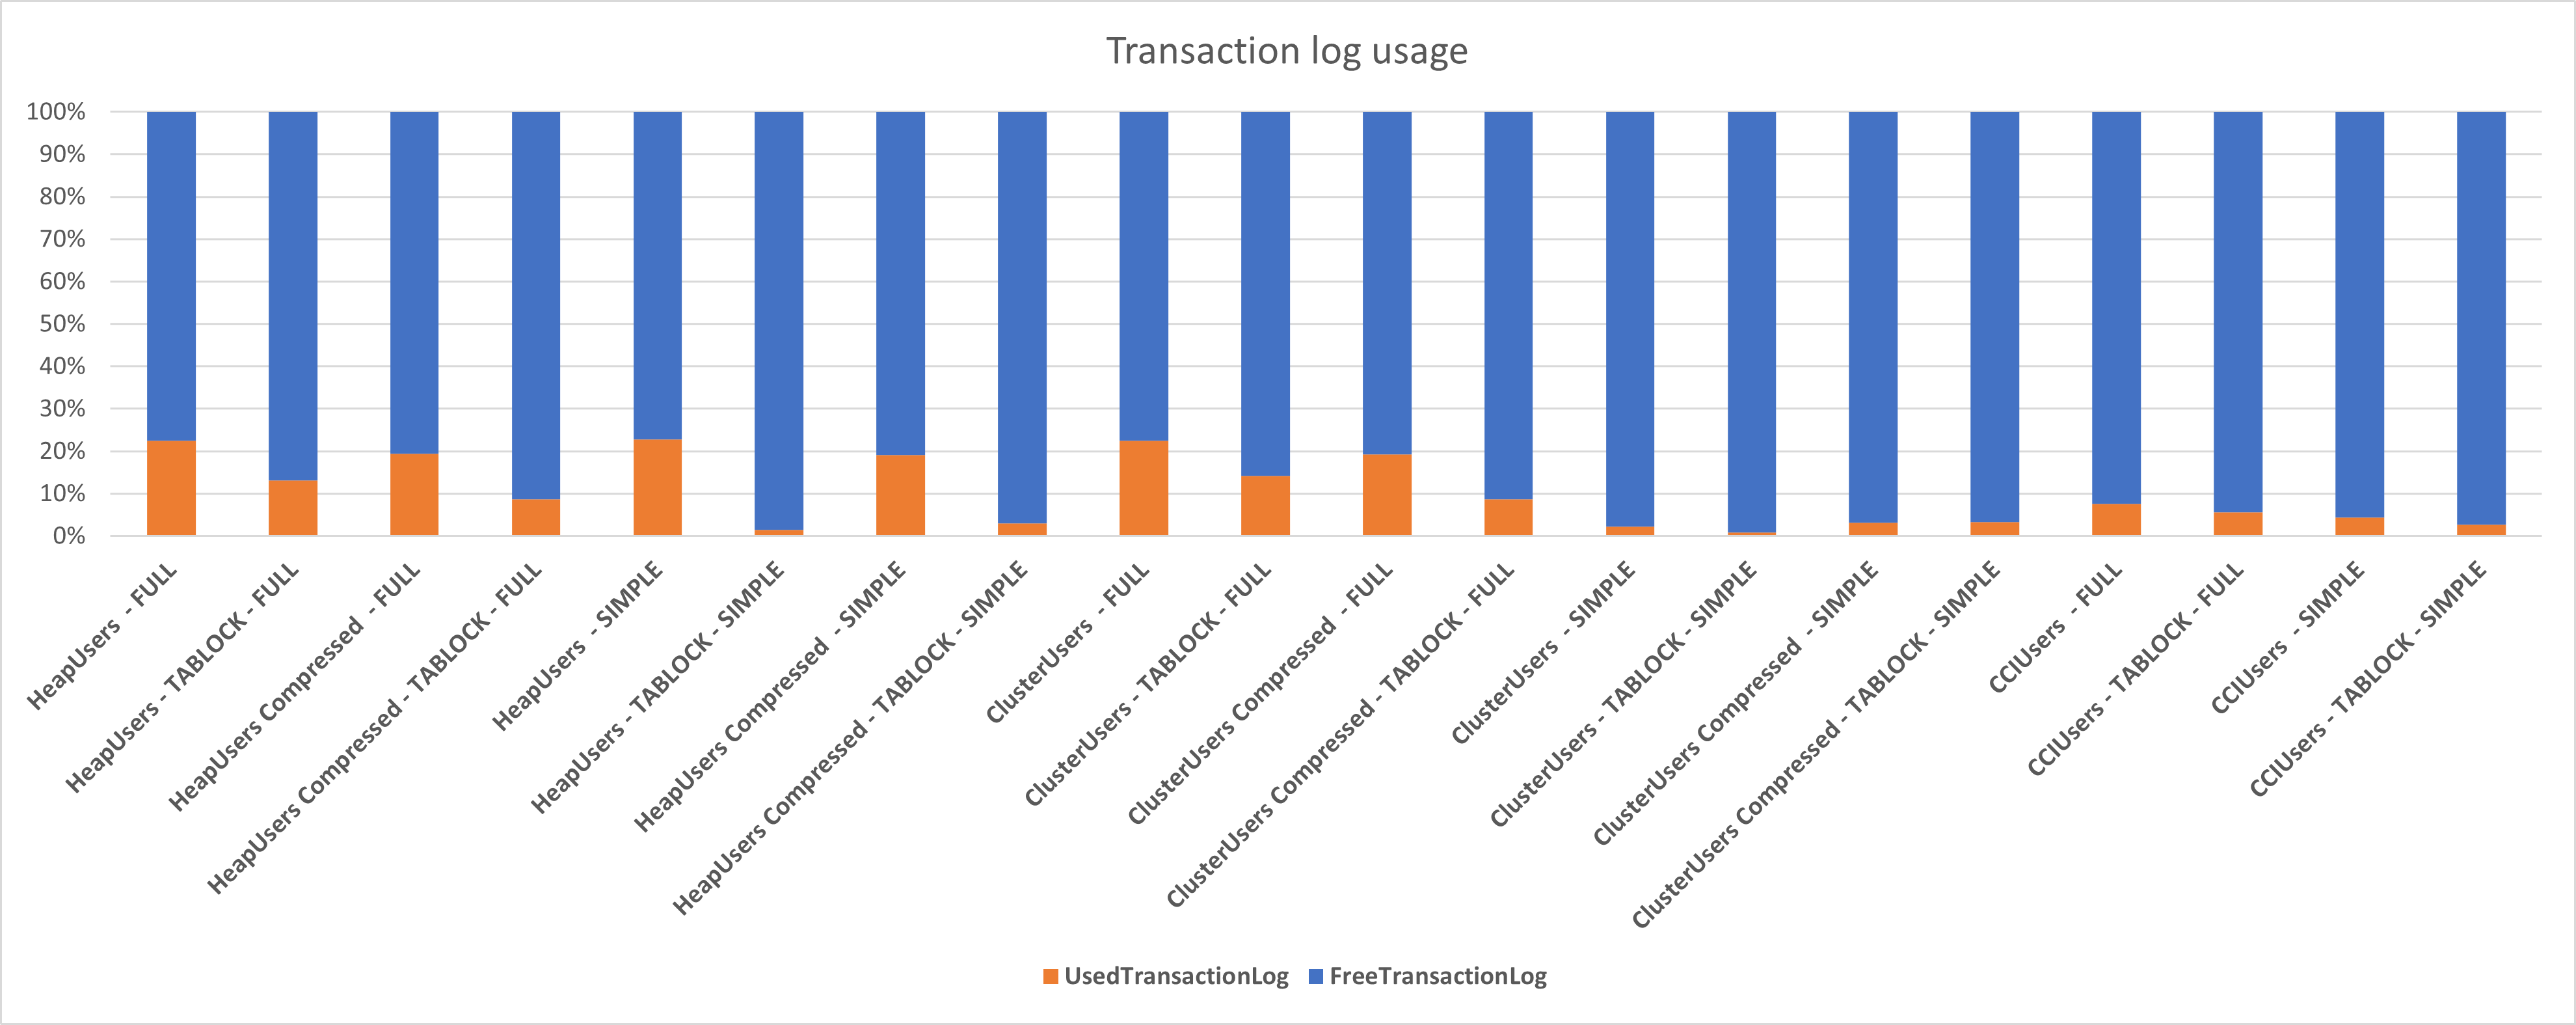
As expected, the lowest transaction log usage occurs when using TABLOCK in combination with the SIMPLE recovery model, but using TABLOCK in FULL recovery model is a good way to help keep transaction log usage under control.
One thing to note is the reduced transaction log usage, even in FULL recovery model without TABLOCK, for the inserts in the CCIUsers table when compared with the same scenario for the HeapUsers and ClusterUsers tables.
Table sizes

The only thing I want to outline here is the size difference between HeapUsers when TABLOCK isn’t used and when it is used.
This is because when a heap is configured for page-level compression, pages receive page-level compression only in the following ways:
- Data is bulk imported with bulk optimizations enabled.
- Data is inserted using
INSERT INTO … WITH (TABLOCK)syntax and the table does not have a nonclustered index. - A table is rebuilt by executing the
ALTER TABLE … REBUILDstatement with the PAGE compression option.
More info on data compression can be found in Microsoft’s documentation.
Bonus: Improve large insert performance when clustered indexes are a must
When running on SQL Server Enterprise edition and a clustered index is mandatory on the target table due to subsequent performance considerations, you can have the best of both worlds, to some extent, by creating the clustered index afterwards.
This is possible because SQL Server Enterprise edition supports parallel index operations. Meaning that, while an insert into a clustered index won’t go parallel, creating a clustered index on a heap can go parallel and the combined execution times of the insert and the index creation will still be lower than just inserting large amounts of data in a clustered index.
For a brief example, using the 1.9 seconds insert into the HeapTable from simple recovery model test run, I create a clustered index on the table using MAXDOP 0.
And, since the Developer edition of SQL Server has all the features available in Enterprise edition, the index creation will go parallel and use all the 24 threads available on my machine.
| 1 2 3 | SET STATISTICS TIME ON; CREATE UNIQUE CLUSTERED INDEX [HeapUsers_IX] ON [dbo].[HeapUsers]([Id]) WITH (MAXDOP = 0); |
The index creation takes 3962 milliseconds, or 3.96 seconds.
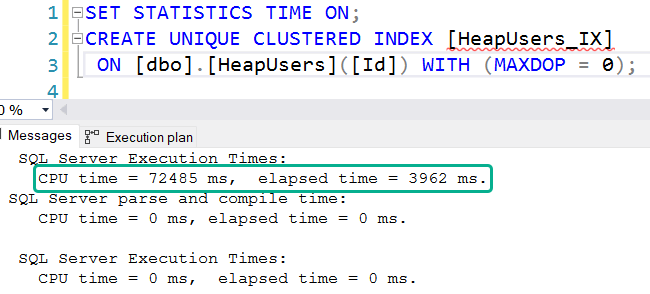
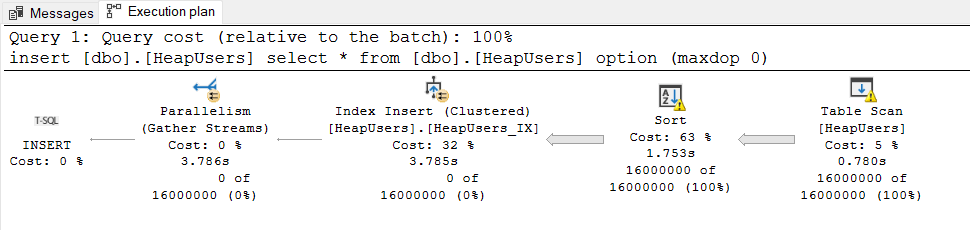
Adding up the clustered index creation time to the insert duration results in the a total duration of 5879 milliseconds, or 5.87 seconds, well under the the fastest test involving the ClusterUsers table
Conclusion
We’ve seen how large insert speeds in SQL Server are affected by multiple factors.
The purpose of this post is to help identify SQL Server’s large insert performance scenario that best fits your needs based on speed, subsequent performance considerations and recovery point objective.
If insert speed is the ultimate goal, then nothing can top heaps.
If you’ve liked this post, I recommend you check out some more performance-related posts:
- Speeding up SELECT COUNT in SQL Server
- Finding Long Values Faster
- Fix implicit conversion when you can’t change the query
2 comments
Very interesting, thanks!
Also, can you see the impact of minimal logging? trace flag 610 ?
It was an article, on BOL, about loading Performance , “The Data Loading Performance Guide” https://learn.microsoft.com/en-us/previous-versions/sql/sql-server-2008/dd425070(v=sql.100)
Hi Sab,
Thank you for the input!
I’ll look into adding some tests with trace flag 610 as an addendum to this post when I have some time for more insert tests.