This post is an overview of PSBlitz, how I use it in diagnosing SQL Server issues, and the notable changes it went through over the past 3 years.
Intro
In case you’re not familiar with it, PSBlitz is a PowerShell script that outputs SQL Server health and performance diagnostics data to either Excel or HTML, and saves execution plans and deadlock graphs as .sqlplan and .xdl files.
If you’re familiar with Oracle’s AWR report, that was what I was aiming for when I started working on PSBlitz. With the difference being that AWR doesn’t offer as much information, nor does it provide execution plans (unless you go in-depth and generate AWR reports for specific sql_id’s).
It’s based on modified non-stored procedure versions of Brent Ozar’s SQL Server First Responder Kit and Erik Darling’s sp_QuickieStore.
Along with some other custom scripts I’ve put together.
You can get more details about its capabilities and usage from my PSBlitz GitHub repo.
Backstory
Back around mid-2022 I was looking for a way to output SQL Server performance diagnostics and health check data in a portable and user-friendly format with minimal effort and no additional perquisites (well, aside from Excel).
As part of the user-friendly requirement I also wanted it to have both a command line mode (you pass options and values in the command line) as well as an interactive mode (it prompts you for pretty much everything and guides you through the options) of executing it.
I knew enough PowerShell to be dangerous, I had no idea of writing complex code outside of T-SQL and the occasional PL/SQL.
But I was curios and stubborn enough to give this a shot.
I wrote the initial version in Notepad++.
And, yeah, ~1.3k lines of PS code in Notepad++ is as hard to work with as you’d imagine.
On August 7th I was comfortable enough with how the script worked to put it on GitHub and create an initial release.
I have a more detailed blog post of how PSBlitz looked and worked back then.
In September it was featured by Brent Ozar as part his “Community Tools Month” event, which gave me the necessary confidence boost to work on expanding and improving PSBlitz.
It steadily grew more complex with every iteration and my PowerShell knowledge also grew alongside it.
One down side is that it also became a pretty big time sink for a while.
With me either burning the midnight oil or spending entire weekends on multiple occasions adding features, improving the code, and fixing bugs.
Since then, I’ve improved my workflow using VS Code (read more about it here), and with automated workload generation for testing PSBlitz before a new release.
Notable changes since then
Aside from “unseen” changes like more robust error handling and making the code more manageable and modular by using functions.
The most notable changes would be:
- Compatibility with PowerShell on Linux.
- Compatibility with Azure SQL DB and Azure SQL MI.
- Compatibility with both Windows PowerShell (5.1) and PowerShell Core.
- Code signing PSBlitz.ps1 and file hash validation for all the .sql scripts.
- Option to skip some checks if you don’t consider them necessary.
- Background process that collects active session information at regular, adjustable, intervals.
- Bulk copy button for stats update commands in case of tables with stale stats (HTML report only).
- The ability to export the report in HTML with sort-able and searchable tables.
No longer making Excel a hard prerequisite for PSBlitz. - Hyperlinks leading to pages (blog posts, articles, MS Learn docs) with more details for database settings, health check, index diagnostics, and plan cache findings.
- Retrieving query store (if enabled), statistics and index fragmentation data in case of a database-specific check.
- Ability to automatically perform additional database-specific checks based on plan cache findings in case of an instance-wide check.
- Retaining line breaks in query text.
Line comments (–) no longer turn the retrieved query text into a guessing game at best or a mangled unusable line at worst - Graceful termination in case of user cancellation (Ctrl+C) or terminating error.
A usable report is still generated with the data collected so far and any temporary objects are cleaned up.
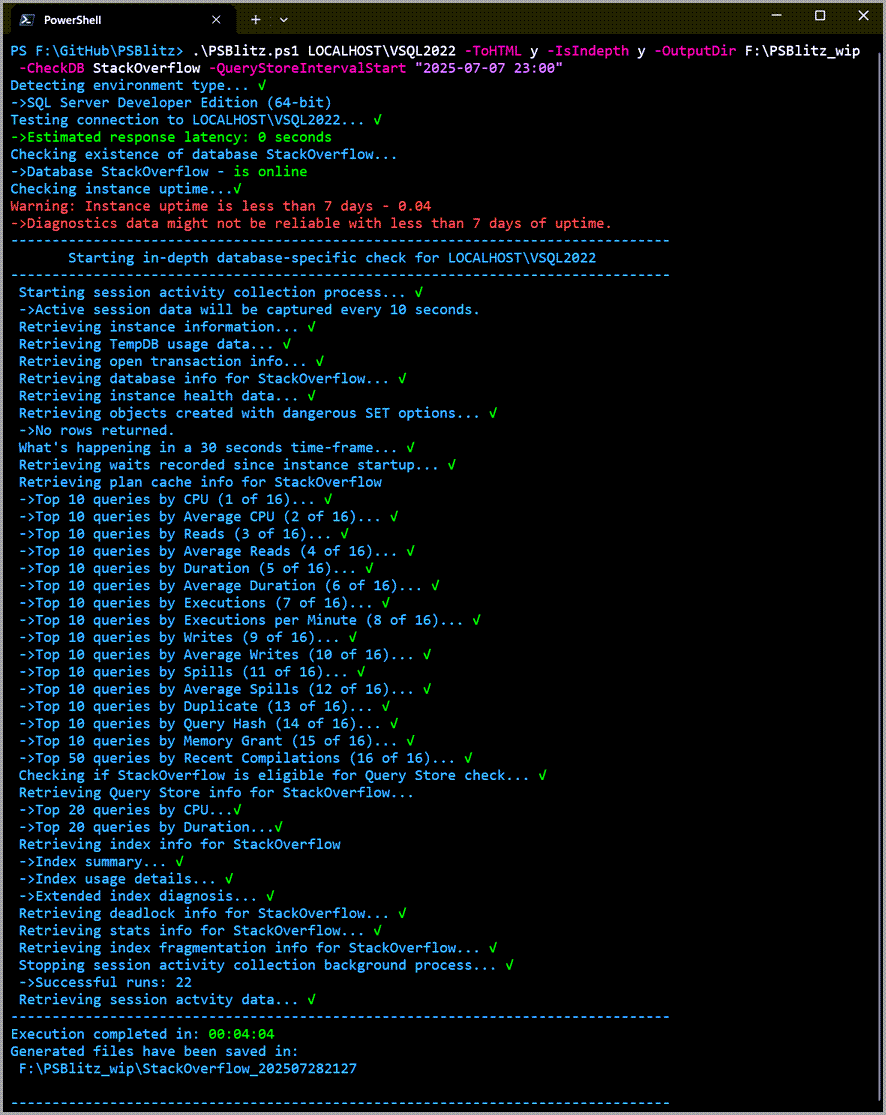
For reference, this is how an in-depth database-specific check execution flow looks like:
And this is the resulting folder structure:

Feedback received
I’ve received great feedback from the community during these 3 years on various platforms (GitHub, e-mail, reddit, LinkedIn).
And this is what kept me motivated to further improve and maintain PSBlitz.
The project currently has 104 stars on GitHub, but I know it’s pretty niche and I also probably don’t do a lot to promote it.
Unexpected bonuses
At my current work place this has become the de-facto method of getting all the useful data required for us to work on fixing SQL Server performance issues both for our customers (in environments we don’t have direct access to), cutting down on time normally spent on back-and-forth messages through tickets or screen sharing calls, as well as from our internal SQL Server environments.
As a result of my work on PSBlitz, I’ve improved my PowerShell coding knowledge considerably, which in turn helped me automate more stuff for my day job.
Additionally, some changes that I’ve needed in Brent’s SQL Server First Responder Kit scripts I’ve also ended up implementing in the original code, so the entire community can benefit:
- Inclusive language in sp_BlitzIndex
- New parameter to preserve new lines in query text returned by sp_BlitzCache
- New security check in sp_Blitz to identify high-privileged service accounts
My first public speaking engagement at OmniOpenCon has been about getting into FOSS to troubleshoot and fix closed source problems by building PSBlitz.
The PSBlitz diagnostics report and how I use it
Note that some images are cropped and some are skipped entirely since they’d end up taking a lot of space and bandwidth.
PSBlitz gets pretty much all the necessary data for diagnosing SQL Server performance issues.

I start out with the Instance and Database information pages, to get an idea of the environment and database configuration.


Then I move on to the health check results.

And mainly “Wait Stats”, but on a case-by-case basis also the Storage and Perfmon Stats pages.

Then I work my way from there through the “Top X Queries By Y”, “Index Diagnostics”, and “Query Store Info CPU/Duration” pages.


If deadlocks are a pain point, then they’ll have their dedicated report page with all the relevant details as well as the aforementioned deadlock graph files.

If PSBlitz was executed during a process that was slow, I’ll also check the “Open Transactions” page, as well as the “Happening Now” and “Aggregated Session Activity” pages.
Based on what I find I can pick the appropriate course of action:
- indexing
- query re-writes
- configuration changes
- application code/behavior changes
What’s next
At some point I’ll have to make PSBlitz use the Microsoft.Data.SqlClient library so that it plays nice with new security requirements.
I’ve also been meaning make a GUI for it and re-usable configurations.
Working on a way to parse and load HTML data into SQL Server for further reporting.
I’ve already started working on this a while ago, just need to expand it.
Conclusions
This is a good example of “necessity is the mother of invention”, and it has been a great learning experience.
It also ended up helping other even though my initial goal was to make my life easier.
If this is the first time you read about PSBlitz and diagnosing SQL Server performance issues is your thing, feel free to give it a try and let me know what you think.