PSBlitz is a PowerShell script that outputs SQL Server health and performance diagnostics data to Excel and saves execution plans and deadlock graphs as .sqlplan and .xdl files.
Introduction
Since I’m a big fan of Brent Ozar’s SQL Server First Responder Kit, and I’ve found myself in many situations where I would have liked a quick way to easily export to Excel the output of sp_Blitz, sp_BlitzCache, sp_BlitzFirst, sp_BlitzIndex, sp_BlitzLock, and sp_BlitzWho, as well as saving to disk the execution plans identified by sp_BlitzCache and sp_BlitzWho together with deadlock graphs from sp_BlitzLock, I’ve decided to put together a PowerShell script that does just that.
The script itself relies on slightly modified versions of Brent’s stored procedures in order to make them portable (they’re no longer stored procedures, just stand-alone scripts)
Features
Outputs the following to an Excel spreadsheet:
- Wait stats – from sp_BlitzFirst
- Currently running queries – from sp_BlitzWho
- Instance health-related findings – from sp_Blitz
- Index-related issues and recommendations – from sp_BlitzIndex
- Top 10 most resource intensive queries – from sp_BlitzCache
- Deadlock related information from the past 15 days – from sp_BlitzLock
- Statistics details for a given database – when a database-specific check is requested
- Index Fragmentation information for a given database – when a database-specific check is requested
sp_BlitzWho is called multiple times during the execution of PSBlitz in order to help get a better sense of what’s actively hitting the instance.
Exports the following files:
- Execution plans (as .sqlplan files) – from the same data set generated by sp_BlitzCache
- Execution plans (as .sqlplan files) – from the sample execution plans provided by
sp_BlitzIndex @Mode = 0andsp_BlitzIndex @Mode = 4for missing index suggestions (only on SQL Server 2019) - Execution plans (as .sqlplan files) of currently running sessions – from the same data set generated by sp_BlitzWho
- Deadlock graphs (as .xdl files) – from the same data set generated by sp_BlitzLock
By default, PSBlitz does a fast check which runs the following:
| 1 2 3 4 5 6 7 | sp_Blitz @CheckServerInfo = 1 sp_BlitzFirst @ExpertMode = 1, @Seconds = 30 sp_BlitzIndex @GetAllDatabases = 1, @Mode = 0 sp_BlitzCache @ExpertMode = 1, @SortOrder = 'CPU'/'avg cpu' sp_BlitzCache @ExpertMode = 1, @SortOrder = 'duration'/'avg duration' sp_BlitzWho @ExpertMode = 1 sp_BlitzLock @StartDate = DATEADD(DAY,-15, GETDATE()), @EndDate = GETDATE() |
PSBlitz can also has in-depth check mode which runs:
| 1 2 3 4 5 6 7 8 9 10 11 12 13 14 15 16 | sp_Blitz @CheckServerInfo = 1, @CheckUserDatabaseObjects = 1 sp_BlitzFirst @ExpertMode = 1, @Seconds = 30 sp_BlitzFirst @SinceStartup = 1 sp_BlitzIndex @GetAllDatabases = 1, @Mode = 1 sp_BlitzIndex @GetAllDatabases = 1, @Mode = 2 sp_BlitzIndex @GetAllDatabases = 1, @Mode = 4 sp_BlitzCache @ExpertMode = 1, @SortOrder = 'CPU'/'avg cpu' sp_BlitzCache @ExpertMode = 1, @SortOrder = 'reads'/'avg reads' sp_BlitzCache @ExpertMode = 1, @SortOrder = 'writes'/'avg writes' sp_BlitzCache @ExpertMode = 1, @SortOrder = 'duration'/'avg duration' sp_BlitzCache @ExpertMode = 1, @SortOrder = 'executions'/'xpm' sp_BlitzCache @ExpertMode = 1, @SortOrder = 'memory grant' sp_BlitzCache @ExpertMode = 1, @SortOrder = 'recent compilations', @Top = 50 sp_BlitzCache @ExpertMode = 1, @SortOrder = 'spills'/'avg spills' sp_BlitzWho @ExpertMode = 1 sp_BlitzLock @StartDate = DATEADD(DAY,-15, GETDATE()), @EndDate = GETDATE() |
If needed, you can run the checks against a specific database either by specifying the name of the database during the interactive execution or via the -CheckDB parameter.
The database-specific check will modify the executions of sp_Blitz, sp_BlitzCache, sp_BlitzIndex, and sp_BlitzLock as follows:
| 1 2 3 4 | sp_Blitz @CheckServerInfo = 1, @CheckUserDatabaseObjects = 0 sp_BlitzIndex @GetAllDatabases = 0, @DatabaseName = 'SomeDB', @Mode = ... sp_BlitzCache @ExpertMode = 1, @DatabaseName = 'SomeDB', @SortOrder = ... sp_BlitzLock @StartDate = DATEADD(DAY,-15, GETDATE()), @EndDate = GETDATE(), @DatabaseName = 'SomeDB' |
Running PSBlitz
PSBlitz can be ran in two ways:
- as any PS script, by calling it either from its directory or using its full path, and providing parameters and values
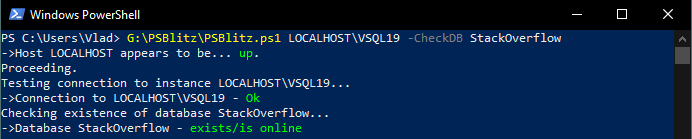
- in interactive mode by right clicking on the script and then clicking on “Run with PowerShell”, which will cause the script to prompt for input
![PowerShell window: Running in interactive mode Server: LOCALHOST\VSQL19 ->Host LOCALHOST appears to be... up. Proceeding. Name of the database you want to check (leave empty for all): SQL login name (leave empty to use integrated security): Perform an in-depth check?[Y/N]: Y Testing connection to instance LOCALHOST\VSQL19... ->Connection to LOCALHOST\VSQL19 - Ok](https://vladdba.com/wp-content/uploads/2022/09/InteractiveExec.png)
During execution, PSBlitz will tell you at which step it currently is, and, when it finishes, it will tell you where the output is saved and how long the execution took.

Output
When the script finishes you’ll have a folder in the same location as PSBlitz.ps1 containing an Excel file with the all the output generated and two sub-directories, one containing deadlock graphs and the other execution plans.

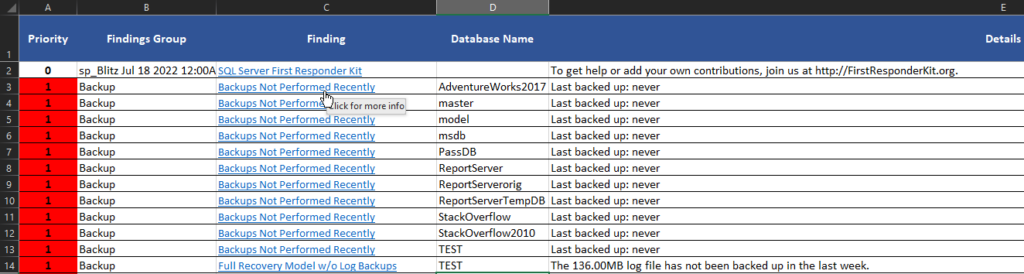
The excel file consists of multiple sheets, with the first sheet acting as an index for the rest of the report.

The rest of the sheets contain the output of the sp_Blitz scripts that you’re most likely already familiar with. The findings also include clickable hyperlinks that provide more explanations and solutions.

How I use it
I use PSBlitz mainly in three situations:
- an instance is seeing sudden performance degradation that’s impacting overall response times in production, and I want to output as much performance diagnostics data as possible with minimal effort in order to start troubleshooting
- I want to collect data to work with and also capture the “before” state of an instance when doing general performance tuning
- I’m monitoring the effects of performance tuning efforts and any other changes that might impact SQL Server’s performance and reliability
Download and more info
For more info and updated versions check out the PSBlitz repository on GitHub.
Any input is welcome, but, since this is a personal project, I’ll address bugs, suggestions, and requests when my schedule allows it.
There is a dev branch, so If you want to make a contribution feel free to make a pull request to it.
10 comments
Amazing! Thanks for sharing it! 🙂
This has saved me so much manual work. Thanks for sharing!
Thanks for sharing!
How can I set the parameter @BringThePain = 1 when your script launches the sp_BlitzIndex?
thank you!
Hi Paul,
At the moment, there’s no direct way of specifying @BringThePain = 1 through PSBlitz, but you can go into ..\PSBlitz\Resources and edit line 47 of spBlitzIndex_NonSPLatest.sql to set @BringThePain = 1 and then it will be used at the next run of PSBlitz.
If this is something you or anyone from the SQL Server community might need to do more often, I will work on a way to pass it as a custom parameter value when executing PSBlitz.
Not sure what I did wrong but when I executed the Powershell
.\psblitzl.ps1 wsfpv02342\mstqip05 -checkdb hgxcore
I got the following message
“script execution was interupted.
Finishing Up….”
and the exel spreadsheet doesn’t have any data.
What I didn’t wrong and how to address it?
Thank you Vlad
Sorry for the late reply.
I took a break from the blog for a couple of months.
Can you please get the latest version of PSBlitz and try running it with the -DebugInfo flag?
When it finishes and prompts for you to press Enter, do so, but do not close the PS window. In most cases, the error will be thrown right after the script exits.
By our description alone, I’d estimate that the failure occurs right during the first or second script that is executed, so either GetInstanceInfo.sql or GetTempDBUsageInfo.sql (they’re both in the Resources directory)
You can test this by just running them from SSMS against your instance and seeing if they error out in any way.
Again, sorry for the late reply.
Thanks for sharing it! 🙂